Points Are the Result. Efficiency Is the Mechanism: Ivy League Offensive Profiles from 2025
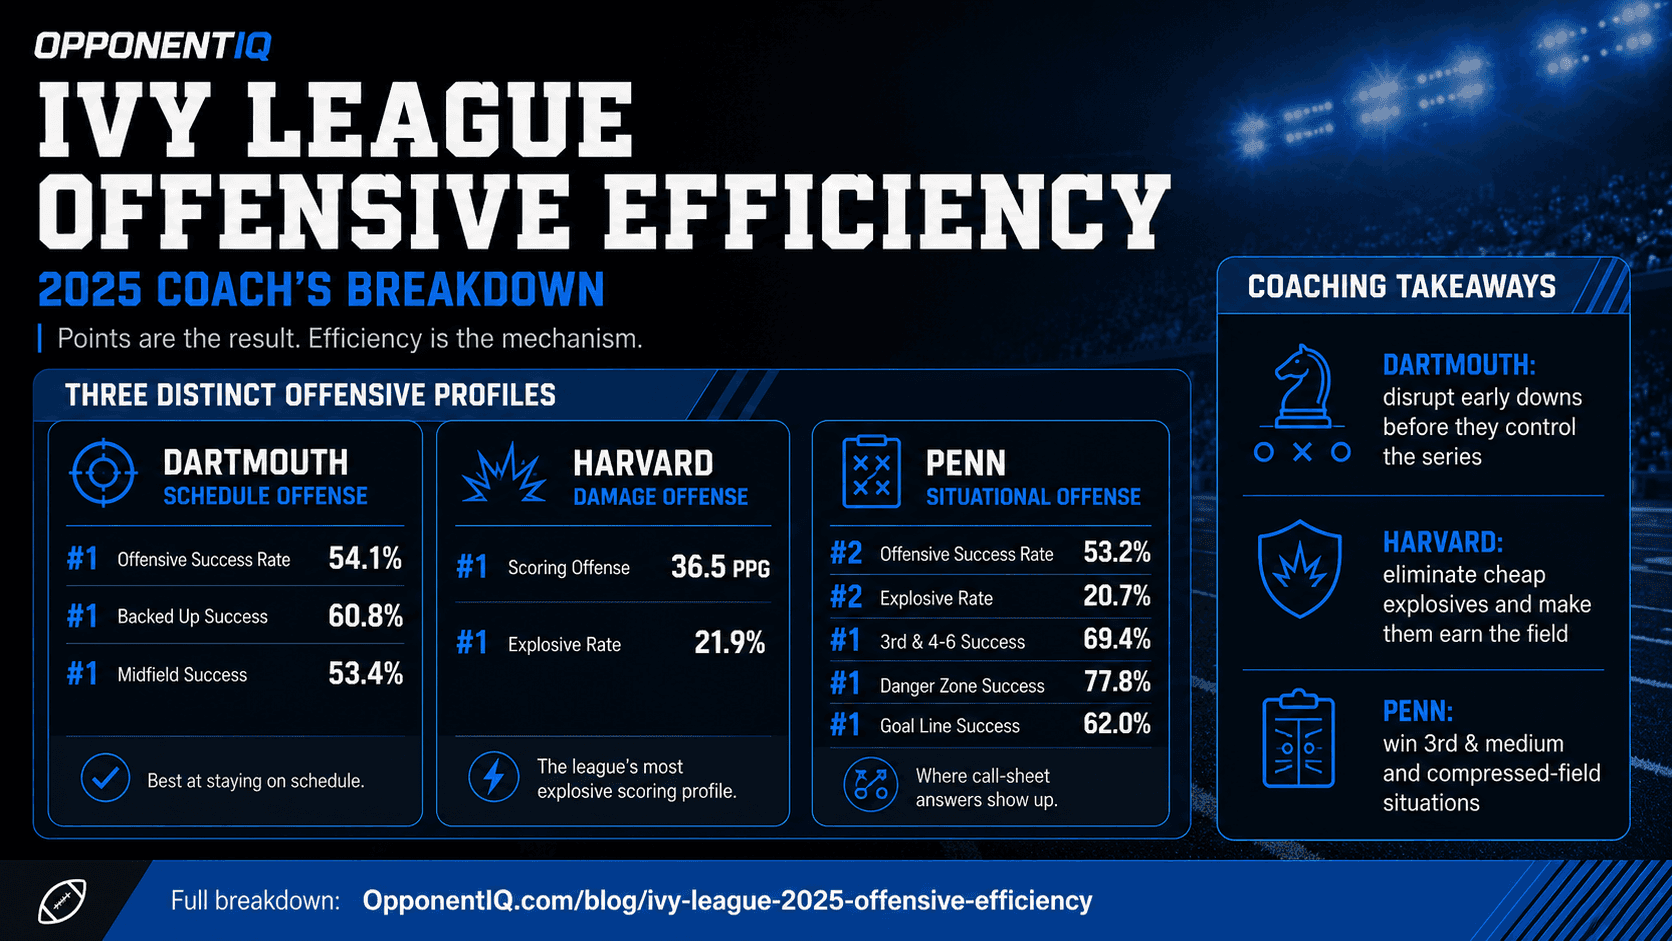
Scoring offense is the headline. Efficiency is the structure underneath it.
That distinction matters when you are building a defensive plan. A high-scoring offense can stress you with explosives, tempo, field position, short fields, quarterback efficiency, or pure drive sustainability. The box score tells you what happened. The efficiency profile tells you how it happened and where the offense is most comfortable operating.
The 2025 Ivy League offensive data gives us three very different profiles at the top of the conference:
Dartmouth was the best chain-moving offense.
Harvard was the best damage offense.
Penn was the most interesting situational offense.
Those are not the same thing, and they should not be defended the same way.
Dartmouth: The Offense That Stayed on Schedule
Dartmouth led the Ivy League in offensive success rate at 54.1%, ahead of Penn at 53.2%, Harvard at 50.5%, and Yale at 50.3%. The league average was 49.5%.
That is the cleanest “stay on schedule” profile in the league. Dartmouth was not the highest-scoring offense, and it was not the most explosive offense, but it was the offense most consistently avoiding bad call-sheet positions.
The more useful piece is where that efficiency showed up.
Dartmouth ranked first in Backed Up offensive success rate at 60.8% and first in Midfield offensive success rate at 53.4%.
That is a defensive coordinator problem because it means the offense was not simply living off short fields. Dartmouth could create breathing room when backed up, stay efficient in the middle of the field, and keep the play caller out of desperation mode.
Against an offense like that, the defensive plan cannot just be “win third down.” If they are consistently creating 2nd & 4, 3rd & 2, and manageable fourth-down decisions, you are already losing the series before the money down arrives.
The priority has to be early-down disruption. Negative plays matter more than “good” five-yard tackles. You need to force the offense into calls it does not want to make.
Harvard: The Offense That Punished You
Harvard had the league’s top scoring offense at 36.5 points per game and the top offensive explosive rate at 21.9%.
That is a different defensive conversation.
Harvard did not need to be the most efficient offense snap to snap because it was the best offense at changing the math of a drive. One explosive can erase two inefficient plays. One vertical shot, one missed fit, one bad leverage angle, and the drive state changes immediately.
That makes Harvard the “margin for error” offense in the conference. You can play 7 or 8 solid snaps and still lose the possession if you give up the wrong one.
The coaching question is not simply, “Can we get them behind the sticks?” The better question is:
Can we make them earn the field in pieces?
Against Harvard, explosive prevention has to be a first-order game-plan item, not a bullet point. Coverage structure, force rules, pursuit angles, second-level eyes, and tackling after the catch all become tied to the same objective: reduce instant offense.
If Dartmouth makes you defend patience, Harvard makes you defend punishment.
Penn: The Situational Offense That Deserves More Attention
Penn is the offense that probably cuts through the clutter the most.
The Quakers ranked second in offensive success rate at 53.2%, second in offensive explosive rate at 20.7%, and third in scoring at 27.1 points per game.
That alone puts them in the top offensive tier, but the situational profile is what makes them interesting.
Penn ranked first in:
3rd & 4-6 offensive success rate: 69.4%
Danger Zone offensive success rate: 77.8%
Goal Line offensive success rate: 62.0%
That is a call-sheet profile.
Third-and-medium is where a coordinator’s answers show up. The menu is still open enough to protect tendencies, but the defense has enough leverage to dictate if it can win the down. Penn’s success in that window suggests they were comfortable living in the part of the game where coverage answers, protection answers, and concept sequencing matter most.
The field-zone data adds another layer. Penn being first in both Danger Zone and Goal Line success means the offense had answers as space compressed. That is not the same as being good between the 20s. Compressed-field offense requires different tools: formation stress, motion leverage, rubs, QB run answers, tempo, condensed splits, or a trusted short-yardage menu.
Penn’s profile says: do not just scout the offense by total output. Scout the situations where the play caller clearly had answers.
The Three Offensive Identities
The cleanest way to separate the top offenses:
Team | Offensive Identity | Defensive Priority |
|---|---|---|
Dartmouth | Schedule offense | Create negative plays early |
Harvard | Explosive offense | Eliminate cheap explosives |
Penn | Situational offense | Win 3rd-medium and compressed field |
That is the difference between ranking teams and preparing for them.
A ranking tells you Harvard was the top overall offensive threat. A scouting report tells you Dartmouth and Penn require completely different defensive plans.
What Actually Matters to a Staff
For a coach, the useful question is not “who is good?”
The useful questions are:
Where does the offense steal efficiency?
Where does the offense generate explosives?
Which downs keep the coordinator on schedule?
Which field zones create their best answers?
Where do they become ordinary?
What do we need to remove first?
That is where the data becomes actionable.
Dartmouth’s profile says you need to disrupt early downs before they control the series. Harvard’s profile says you need to make them drive the ball without explosive shortcuts. Penn’s profile says you need to study the high-leverage call sheet, especially 3rd & 4-6, Danger Zone, and Goal Line.
The edge is not knowing that a team is efficient.
The edge is knowing where that efficiency lives.
