OpponentIQ Conference Spotlight: What the 2025 NJAC Data Reveals About Winning Football
OpponentIQ Conference Spotlight: What the 2025 NJAC Data Reveals About Winning Football
Conference-wide benchmarking shows how Salisbury, Christopher Newport, Rowan and TCNJ created competitive advantages in very different ways.
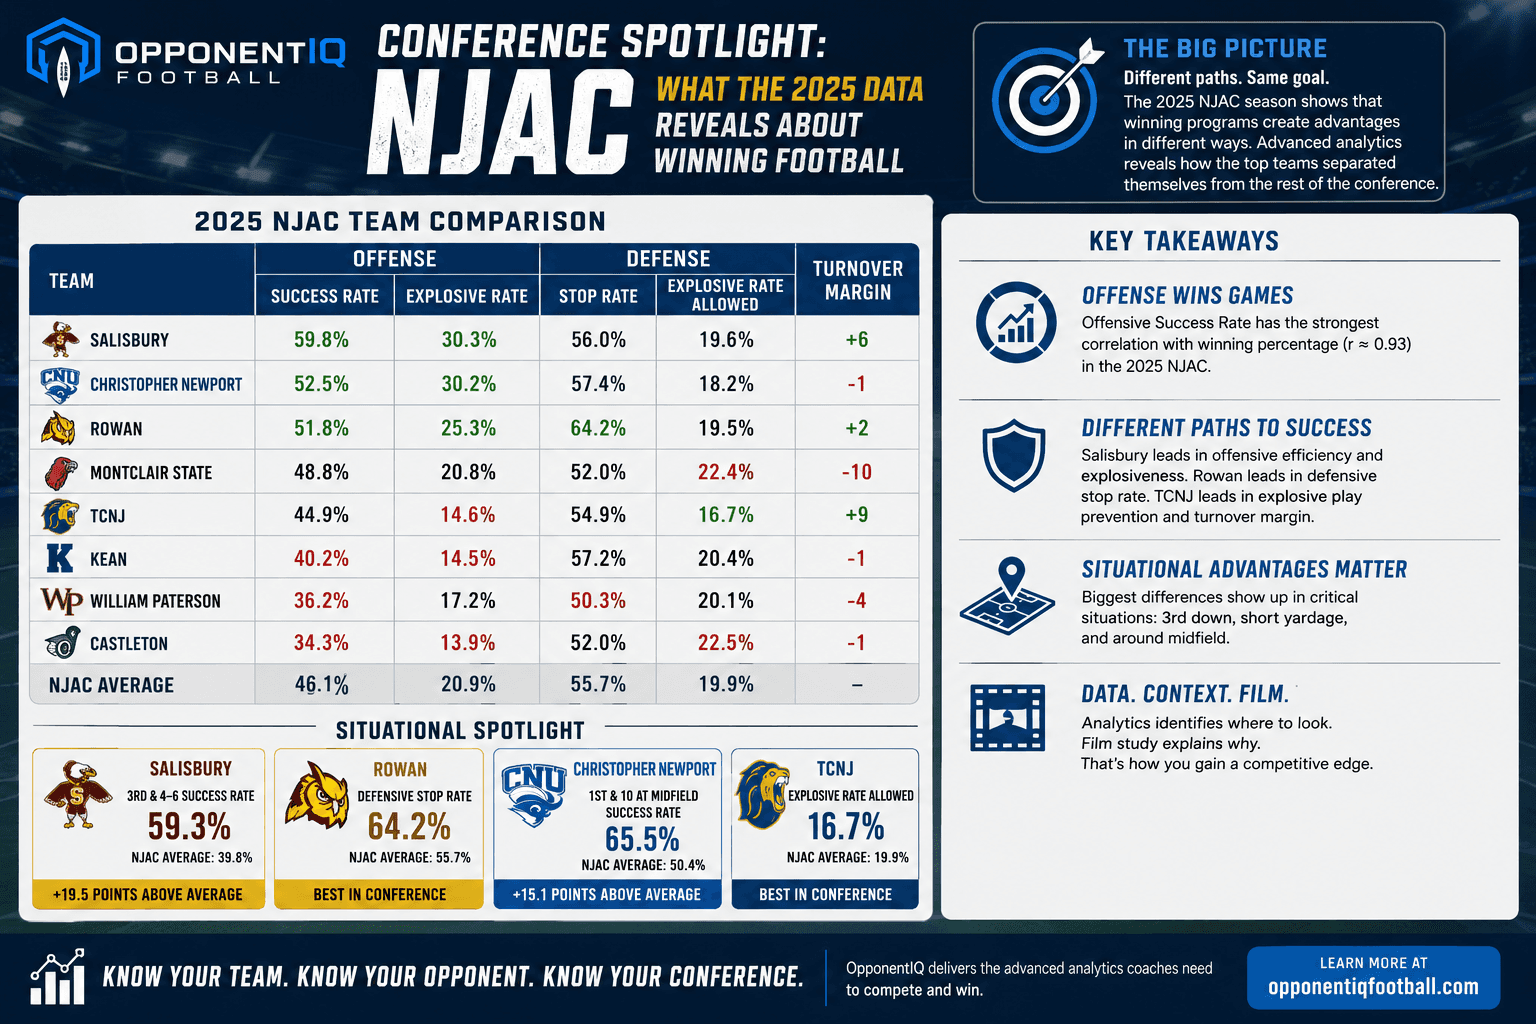
Welcome to the OpponentIQ Conference Spotlight, a series examining what advanced football analytics can tell us about teams, styles of play and competitive advantages across individual college football conferences.
Our first case study is the New Jersey Athletic Conference (NJAC).
Using 2025 conference data, we can move beyond traditional standings, scoring averages and total yardage to examine a more interesting question:
What actually separated the best teams in the NJAC from the rest of the conference?
The answer is not one statistic.
Salisbury separated itself through exceptional offensive efficiency and explosiveness. Christopher Newport paired efficiency with one of the league's strongest explosive-play profiles. Rowan produced the conference's most consistent defensive performance. TCNJ succeeded with a different formula built partly around explosive-play prevention and turnover margin.
Those distinctions illustrate why evaluating football teams requires context.
A team's success rate, explosive rate or third-down efficiency tells us something.
Knowing how those numbers compare with every team in the conference tells us considerably more.
Why Conference Benchmarking Matters
Suppose an offense has a 50% success rate.
Is that good?
If the conference average is 46%, probably.
If the best offenses in the league are operating at 58-60%, however, a 50% success rate may also reveal a meaningful competitive gap.
The same problem exists with almost every football statistic.
A 40% third-down success rate has little meaning without knowing:
the conference average;
the distribution between the best and worst teams;
the specific down-and-distance situation;
field position;
score state;
sample size;
and how the team's performance changes across those variables.
This is where conference-level analytics become particularly useful.
Instead of analyzing a team in isolation, OpponentIQ allows a staff to establish a competitive baseline.
The question changes from:
"How are we performing?"
to:
"Where are we gaining or losing an advantage relative to the teams we have to beat?"
The 2025 NJAC provides a good example.
Two Dimensions of Offensive Performance
One of the easiest analytical mistakes in football is trying to describe an offense with one statistic.
Two useful measures are success rate and explosive-play rate, because they capture different components of offensive performance.
Success rate measures down-to-down efficiency.
A play is considered successful based on how much of the required yardage is gained relative to the down:
First down: at least 40% of yards needed
Second down: at least 60%
Third or fourth down: enough yardage to convert
An offense with a high success rate consistently stays ahead of the chains and avoids negative situations.
Explosive rate measures something different.
It identifies how frequently an offense generates high-value chunk plays.
A team can therefore have several different offensive profiles.
It might be highly efficient but relatively methodical.
It might struggle with consistency but compensate with explosives.
Or, in the case of the conference's best offenses, it may excel at both.
2025 NJAC Offensive Comparison
Team | Offensive Success Rate | Explosive Rate |
|---|---|---|
Salisbury | 59.8% | 30.3% |
Christopher Newport | 52.5% | 30.2% |
Rowan | 51.8% | 25.3% |
Montclair State | 48.8% | 20.8% |
TCNJ | 44.9% | 14.6% |
Kean | 40.2% | 14.5% |
William Paterson | 36.2% | 17.2% |
Castleton | 34.3% | 13.9% |
NJAC Average | 46.1% | 20.9% |
The first thing that stands out is Salisbury.
The Sea Gulls produced a 59.8% offensive success rate, 13.7 percentage points above the NJAC average.
At the same time, Salisbury generated explosive plays on 30.3% of its offensive snaps, compared with the 20.9% conference benchmark.
That is a difficult combination to defend.
Explosive offenses sometimes accept inefficiency as the cost of pursuing big plays.
Salisbury did not have to make that tradeoff.
It produced the conference's highest success rate while also producing the highest explosive rate.
Christopher Newport's profile was slightly different.
CNU essentially matched Salisbury in explosive rate at 30.2%, while producing a still-excellent 52.5% success rate.
Rowan followed at 51.8% success and 25.3% explosives.
Already we can see that simply knowing which teams scored the most points does not tell the entire story.
Conference benchmarking begins to show how those offenses generated their production.
The Gap Between the Conference's Top and Bottom Teams
Another way to evaluate the league is to compare its stronger teams with the bottom half of the standings.
The top four teams in the dataset—Christopher Newport, Salisbury, Rowan and TCNJ—averaged approximately:
52.3% offensive success
25.1% offensive explosive rate
59.2% defensive stop rate
18.6% explosive rate allowed
The bottom four averaged approximately:
39.9% offensive success
16.6% offensive explosive rate
52.3% defensive stop rate
20.7% explosive rate allowed
The most pronounced separation came offensively.
The stronger group held roughly a 12.4 percentage-point advantage in offensive success rate and an 8.5-point advantage in explosive rate.
The defensive differences existed, but the offensive separation was considerably larger.
That matters from a program-evaluation perspective.
If a coaching staff is trying to determine why it sits below the conference's top tier, the immediate assumption might be:
"We need to play better defense."
The data might point somewhere else.
If the offense is operating near 38-40% success while the conference's better programs are above 50%, hundreds of marginally less-successful snaps accumulate over the course of a season.
Conference benchmarking helps identify which performance gaps are actually large enough to demand attention.
Which Metrics Were Most Closely Associated With Winning?
There are only eight teams in this dataset, so we should be careful not to overstate statistical relationships.
Correlation also does not establish causation.
Still, the descriptive relationships between several performance metrics and winning percentage are noteworthy.
Across the 2025 NJAC dataset, the approximate correlations with winning percentage were:
Offensive Success Rate: r ≈ 0.93
Offensive Explosive Rate: r ≈ 0.87
Defensive Stop Rate: r ≈ 0.76
Explosive Rate Allowed: r ≈ -0.42
Within this particular conference and season, offensive efficiency displayed the strongest relationship with winning among these measures.
That should not be interpreted as evidence that defense or explosive-play prevention does not matter.
The better interpretation is that the largest differentiator in this particular sample appears to have been consistent offensive efficiency.
That is exactly why conference-specific analysis is useful.
The competitive characteristics of one conference or season do not necessarily mirror another.
In a different league, explosive-play prevention, rushing efficiency, defensive stop rate or another factor might create much greater separation.
The purpose of benchmarking is to identify what actually differentiates performance within the competitive environment being studied.
Salisbury: Efficiency Without Sacrificing Explosiveness
Season-level numbers tell us Salisbury was highly efficient.
Situational analysis shows where that advantage became especially pronounced.
Consider several down-and-distance situations.
2nd & 1-3
Salisbury: 84.4% success
NJAC Average: 65.5%
Difference: +18.9 percentage points
2nd & 7-10
Salisbury: 56.2%
NJAC Average: 40.3%
Difference: +15.9 percentage points
3rd & 4-6
Salisbury: 59.3%
NJAC Average: 39.8%
Difference: +19.5 percentage points
That begins to tell us much more than Salisbury's overall 59.8% success rate.
The offense was not simply accumulating efficiency in favorable situations.
It substantially outperformed the conference in situations where drives commonly stall.
Third-and-medium is particularly interesting.
League-wide, offenses were successful roughly 40% of the time.
Salisbury approached 60%.
For an opposing coach, that statistic should trigger another level of analysis.
Why?
What concepts is Salisbury using?
What personnel groupings?
What defensive structures are opponents showing?
Does quarterback run involvement change the math?
Are formations creating favorable leverage?
Are certain calls disproportionately responsible for the advantage?
Analytics do not answer every football question.
What they can do extraordinarily well is identify which questions deserve to be asked.
Instead of watching hundreds of snaps without a hypothesis, a staff can isolate areas where an opponent behaves materially differently from the conference.
That makes film study more targeted.
Rowan: A Different Path to Winning
Rowan provides an excellent contrast.
Its offense was productive:
51.8% offensive success
25.3% explosive rate
But Rowan's most distinctive conference-level advantage came on defense.
The Profs produced a 64.2% defensive stop rate, the highest in the NJAC and significantly above the conference average of 55.7%.
Situational performance makes the profile even more interesting.
Opponent Success on 1st & 10
Against Rowan: 37.0%
NJAC Average: 47.5%
Rowan held a 10.5-point advantage on the most common down-and-distance situation in football.
Now consider short-yardage third down.
Opponent Success on 3rd & 1-3
Against Rowan: 42.3%
NJAC Average: 60.9%
Difference: 18.6 percentage points
Those two numbers describe a defense capable of winning in very different situations.
On first down, Rowan was preventing offenses from consistently staying on schedule.
On short-yardage third downs—situations designed to favor the offense—it substantially outperformed the conference.
That profile looks different from Salisbury's.
Both teams were successful, but their relative advantages were not identical.
That is an important point for any staff using analytics for self-scout.
There is no single statistical blueprint that every successful football team must follow.
The more useful exercise is determining what your team's competitive identity actually is and whether it creates enough separation relative to the rest of the league.
Christopher Newport: Efficiency Changes With Field Position
Down-and-distance is only one layer of situational analysis.
Field position provides another.
Christopher Newport finished with a 52.5% overall offensive success rate, but the offense became especially efficient around midfield.
In OpponentIQ's Midfield Offensive zone:
Christopher Newport: 60.5% success
NJAC Average: 48.3%
That is a 12.2 percentage-point advantage.
The difference becomes even more pronounced when field position and down-and-distance are combined.
On 1st & 10 around midfield, Christopher Newport generated a 65.5% success rate, compared with a conference benchmark of approximately 50.4%.
Why might that matter?
Because offensive and defensive behavior can change once the ball approaches or crosses midfield.
An offense may become more aggressive.
Fourth-down strategy can change.
Vertical shots may become more attractive.
Defensive coordinators may change pressure or coverage tendencies.
A raw season success rate cannot identify those changes.
A field-position split can.
And once a staff identifies an unusually strong zone, it can go back to the film and determine whether the advantage comes from scheme, personnel, play selection or opponent behavior.
TCNJ: Why Efficiency Metrics Need Multiple Dimensions
TCNJ illustrates another important analytical principle.
No single efficiency statistic captures everything that contributes to winning.
TCNJ's offensive performance fell below the conference average:
44.9% offensive success
14.6% explosive rate
Its overall defensive stop rate was also slightly below the NJAC average:
54.9% versus 55.7%.
Yet TCNJ finished 6-4 and allowed only 18.9 points per game, the lowest figure in the dataset.
What helps explain the difference?
Two statistics immediately stand out.
TCNJ allowed explosive plays on only 16.7% of defensive snaps, the lowest rate in the conference.
It also finished with a +9 turnover margin, the best figure in the NJAC.
That creates a very different defensive profile.
TCNJ was not necessarily dominating every snap according to stop rate.
Instead, its defense appears to have been much better at preventing damaging plays, while the team also generated a substantial turnover advantage.
That is an important distinction.
A defense can potentially give up some successful five- or six-yard plays and still remain effective if it prevents explosives, creates turnovers and performs well in high-leverage situations.
Looking only at overall defensive success would obscure that story.
Montclair State Shows Why Outcomes and Process Metrics Can Diverge
Montclair State provides an interesting example in the opposite direction.
Its offensive success rate was 48.8%, above the 46.1% NJAC average.
Its explosive rate was 20.8%, almost exactly in line with the 20.9% conference average.
Those metrics describe an offense that was at least competitive with the middle of the conference.
Yet Montclair finished 5-5.
One number immediately worth investigating is turnover margin:
-10, the lowest in the conference.
That does not prove turnovers alone explain the record.
But it changes where an analyst or coaching staff should look next.
If a team is performing reasonably well on a snap-to-snap basis but overall outcomes lag behind, the gap may reside elsewhere:
turnovers;
special teams;
red-zone execution;
explosive plays allowed;
late-game situations;
penalties;
field position.
Analytics should progressively narrow the problem.
The goal is not to generate a leaderboard.
The goal is to identify which part of the team's performance deserves deeper investigation.
Defining What "Good" Actually Means
Conference benchmarking is also useful because coaches frequently evaluate statistics without a meaningful reference point.
Consider 3rd & 4-6.
The NJAC average offensive success rate was approximately 39.8%.
But individual team performance varied dramatically.
Among the leaders:
Salisbury: 59.3%
Rowan: 56.7%
Castleton: 52.2%
At the other end:
TCNJ: 28.1%
William Paterson: 18.8%
Imagine a staff whose offense converts 38% of these situations.
Without context, 38% may sound reasonable.
Conference benchmarking reveals two things simultaneously.
First, the team is roughly average.
Second, the best teams are producing successful plays 15-20 percentage points more frequently.
That changes the coaching question.
Instead of:
"Are we okay on third down?"
the staff can ask:
"Why are the best teams in our conference dramatically outperforming us in this specific situation?"
That question can lead directly into scheme analysis.
What concepts are producing those conversions?
Are teams using different formations?
Motion?
Quarterback runs?
Protection schemes?
Route distributions?
Personnel?
The league benchmark identifies the performance gap.
Film and football knowledge explain it.
Combining Situations Creates More Powerful Analysis
The next analytical layer comes from combining variables.
Third-down statistics are useful.
Red-zone statistics are useful.
But third-and-medium in the red zone is a much more specific football situation.
For example, Salisbury produced an 83.3% offensive success rate on Red Zone 3rd & 4-6 opportunities in the dataset, compared with an available conference benchmark of roughly 40.8%.
That's an enormous observed difference.
But this is also where analytical discipline becomes important.
As filters become more specific, sample sizes shrink.
An 80% rate across five plays should not be treated the same way as an 80% rate across 50.
Granular football analytics therefore works best when coaches consider three things together:
Magnitude of the difference + sample size + film validation.
Large deviations from the conference mean are signals.
They are not automatically conclusions.
If a team dramatically outperforms the league in a particular situation, the appropriate response is to identify the relevant snaps and investigate why.
Analytics Should Make Film Study More Efficient
A football staff's scarcest resource is not data.
It is time.
Suppose an opponent has played ten games and averages roughly 65 offensive snaps.
That is approximately 650 offensive plays available for review.
A coach can watch all 650.
But watching film and extracting the most important information from film are not necessarily the same thing.
Without context, every snap initially carries similar informational weight.
Analytics can change that.
If OpponentIQ shows that an opponent performs dramatically above conference averages in:
3rd & 4-6;
midfield first downs;
backed-up situations;
red-zone third down;
late-half possessions;
those situations can immediately receive additional scrutiny.
The analytics become a way of ranking the informational value of the film.
The same applies to self-scout.
A team might discover that its overall offensive efficiency is above average while its performance on 2nd & long is near the bottom of the conference.
Or a defense might rank highly in overall stop rate while giving up significantly more explosives than its peers.
Those are actionable differences.
From Tendency Data to Competitive Intelligence
Traditional self-scout asks:
What do we do?
Traditional opponent scouting asks:
What does our opponent do?
Conference-wide analytics introduces a third question:
How unusual is what we're seeing?
That may be the most important question of the three.
Suppose an opponent has a 52% success rate on second down.
That number sounds good.
But if the conference average is 51%, it may not represent a meaningful competitive advantage.
Now suppose that same opponent produces a 59% success rate on 3rd & medium while the conference averages approximately 40%.
That is different.
A nearly 20-point deviation from the league benchmark is a signal worth investigating.
This is where benchmarking moves beyond basic tendency reporting.
It helps coaches separate ordinary behavior from potentially meaningful competitive advantages.
What the 2025 NJAC Tells Us
Our first OpponentIQ Conference Spotlight demonstrates an important point:
Successful teams within the same conference can win in materially different ways.
Salisbury's profile was built around exceptional offensive efficiency combined with explosive-play generation.
Christopher Newport also produced elite explosiveness while showing particularly strong efficiency in certain areas of the field.
Rowan separated itself through defensive stop rate and situational defense.
TCNJ produced a different defensive profile built around limiting explosives and generating a favorable turnover margin.
Those distinctions can be difficult to see in conventional standings or box-score statistics.
Conference-wide situational analysis provides another layer.
It allows staffs to compare not only what happened, but how efficiently teams performed across the situations that repeatedly determine football games.
And it creates a more useful question for coaches:
Where does our football team have a measurable edge—and where are the teams we need to beat better than us?
That is the idea behind the OpponentIQ Conference Spotlight series.
In upcoming editions, we'll apply the same framework to other college football conferences and examine whether the statistical characteristics of winning teams remain consistent—or change significantly from league to league.
Know your team. Know your opponent. Know your conference.
